Expert witnesses and consulting firms
An expert in pharmacovigilance, epidemiology or regulatory affairs signs a report, then defends its method in deposition and at a Rule 702 hearing. Every number needs its query, its term list and its data version. Every "none found" needs the search behind it. Consulting firms do the same work across matters, for counsel on either side.
Four questions from a report in progress
"Which terms make up 'eye damage', and which query and data version sit behind each number?"
What comes back: the term list, the method and the data version behind each calculated figure. The Method and runs card states the data in one line: "Every figure on these cards comes from the data snapshot of FAERS through 2026Q2, held from 2004Q1; snapshot 27 Oct 2026", followed by the PubMed, documents and ClinicalTrials.gov loads with their dates and "15 saved searches; open any card's method to repeat one."

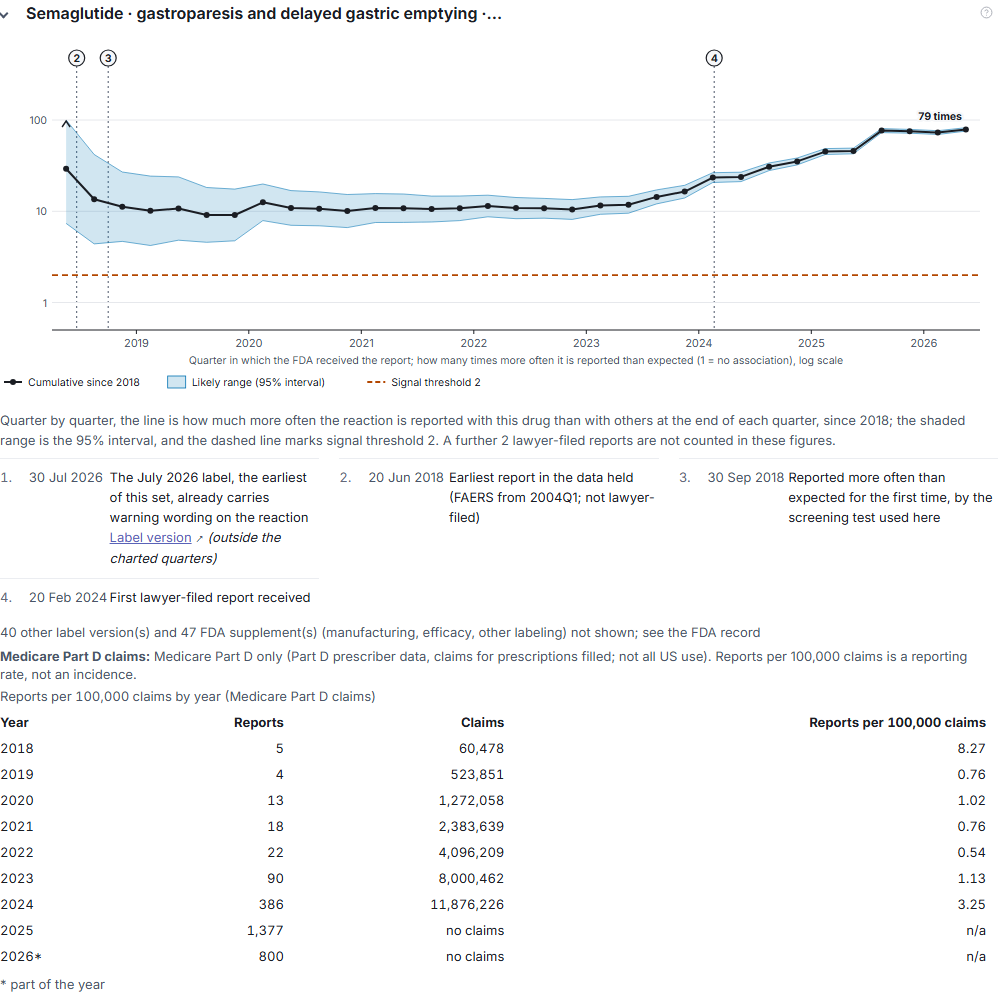
"Is there a disproportionality signal for gastroparesis with semaglutide? Show how it developed over time."
What comes back: the cumulative PRR for every quarter with its report count, from "2018Q2, 29.2 (2)" to "2026Q2, 78.9 (2,715)", the rule applied ("PRR ≥ 2, chi-squared ≥ 4, and at least 3 reports") and the date the EB05 threshold was met. The chart plots the cumulative PRR on a log scale with its 95% interval and the threshold; each quarter is recalculated from the current snapshot, with every case counted from its first receipt date. Numbered markers date the earliest report in the data ("20 Jun 2018 ... not lawyer-filed") and the first lawyer-filed one ("20 Feb 2024"). Under the chart, Medicare Part D claims and Medicaid prescriptions are kept as two separate tables (Year, Reports, Claims, Reports per 100,000 claims). The reports are the general FAERS series, not only those on Medicare patients, so the ratio is unmatched and descriptive; the card cautions "Reports per 100,000 claims is a reporting rate, not an incidence."
"What does the published literature say about fluoroquinolones and tendon rupture, and when was the first study?"
What comes back: "72 publications on ciprofloxacin and tendon rupture were found; the first appeared in Oct 1992, and 25 are case reports." The card counts them by design (31 studies, 25 case reports, 12 meta-analyses, 4 observational studies), states the search ("PubMed searched on 2026-10-27: 73 hits for this query, all held"), and flags "1 of 72 studies have an author affiliated with a company of the drug." The card also charts publications per year by design. Each study row gives its date, design and journal, with the findings quoted.

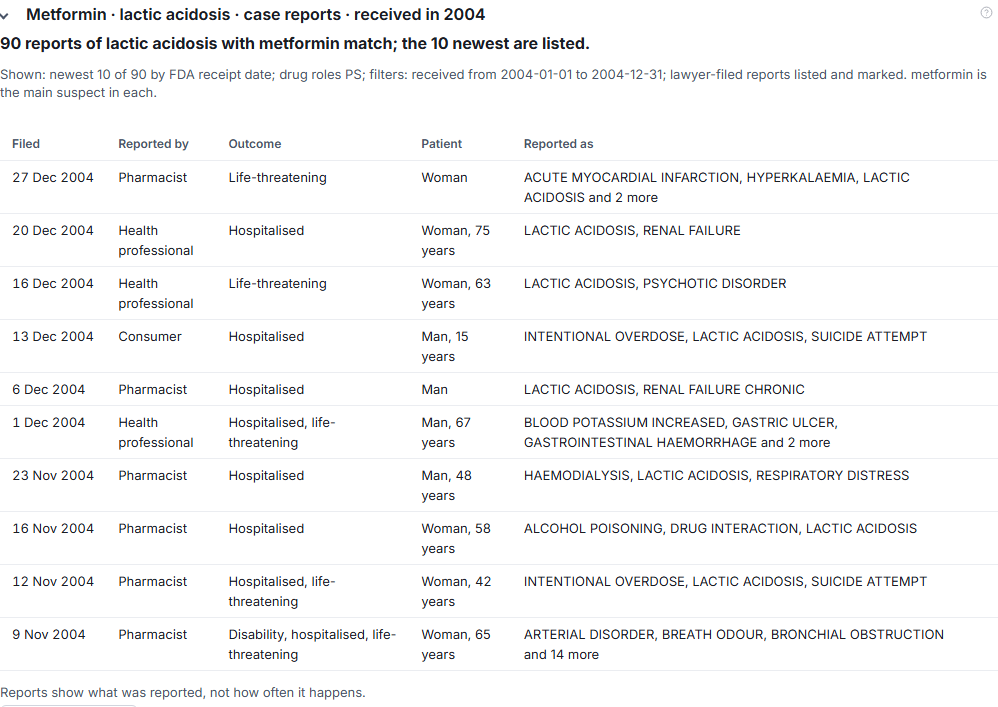
"Show the FAERS reports of lactic acidosis with metformin: the earliest reports and who filed them."
What comes back: the report list with its filters stated: "Shown: newest 10 of 90 by FDA receipt date; drug roles PS; filters: received from 2004-01-01 to 2004-12-31; lawyer-filed reports listed and marked." Columns: Filed, Reported by, Outcome, Patient, Reported as.
How the counts are made
The four measures safety agencies use are computed for each drug and reaction: PRR, ROR, IC and EBGM, each with its interval (95% for PRR, ROR and IC; EB05 to EB95, a 90% interval, for EBGM), over FAERS from 2004. The quarterly history chart plots PRR or EB05, recalculated from the current snapshot with each case counted from its first receipt date. Counts are one report per FAERS case id. Likely duplicates across case ids are found by probabilistic record linkage (Fellegi-Sunter, the method behind WHO-UMC's vigiMatch) and shown as a check on how the measures move without them. Lawyer-filed reports are flagged, and a signal can be shown with and without them.
The standard on cross-examination
Under Rule 702, the proponent must show it is more likely than not that the testimony will help the trier of fact, rests on sufficient facts or data, is the product of reliable principles and methods, and reflects a reliable application of those methods to the case.[1] Daubert v. Merrell Dow Pharmaceuticals (1993) made the trial judge the gatekeeper and listed factors that include testability, peer review and error rates.[2] The snapshot, the filters and the rerun command answer the method questions from either side.
What you can check
- The passage behind each statement, opened beside the answer with the supporting text highlighted.
- The kind of each date: published, submitted or approved.
- "How this is measured" and "Search scope and limits" under each card.
- The Expert pack (zip): every card in the answer stamped with its data snapshot, code version and method version; the methods appendix; and a command that reruns the eligible snapshot-backed calculations on the same snapshot and lists the exhibits it cannot verify.
- Export as PDF or Word.
Sources
- Federal Rule of Evidence 702. https://www.law.cornell.edu/rules/fre/rule_702
- Daubert v. Merrell Dow Pharmaceuticals, Inc., 509 U.S. 579 (1993), decided June 28, 1993. https://www.law.cornell.edu/supct/html/92-102.ZO.html