Adverse event reports
Kelsey holds 21 million reports of suspected side effects sent to FDA: FAERS and its predecessor AERS, from 2004. FDA now names the system the Adverse Event Monitoring System (AEMS), formerly FAERS.[1] Counts are one report per FAERS case id.
The signal, quarter by quarter
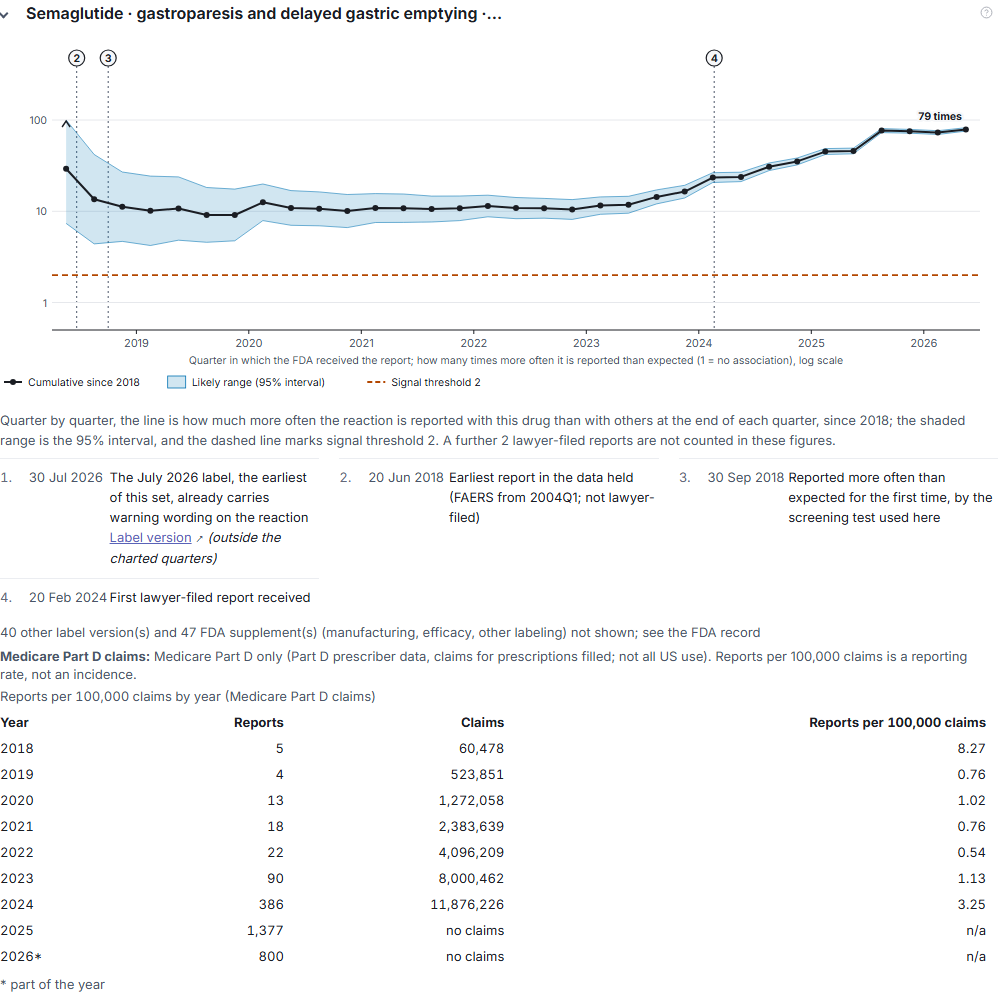
Is there a disproportionality signal for gastroparesis with semaglutide? Show how it developed over time.
What comes back: "The cumulative PRR first met the stated signal rule on Sep 30, 2018, and was 78.9 by 2026Q2, based on 2,715 non-lawyer reports." The chart plots the cumulative PRR each quarter on a log scale, with the 95% interval shaded and signal threshold 2 dashed. It is a retrospective calculation: each quarter is computed from the current snapshot, with every case counted from the date FDA first received it. Numbered markers date the events on the axis:
- 20 Jun 2018: earliest report in the data held
- 30 Sep 2018: reported more often than expected for the first time, by the screening test used
- 20 Feb 2024: first lawyer-filed report received
Under the chart, a table by year gives the reports and the claims in separate columns, in two separate series: Medicare Part D claims and Medicaid prescriptions. For 2024 it lists 386 reports and 11,876,226 Part D claims, and divides one by the other: 3.25 per 100,000. The reports are the general FAERS series for the drug and reaction, not only reports on Medicare patients, so the figure is an unmatched descriptive ratio. The card says: "a reporting rate, not an incidence."
The four measures
For one drug and one reaction, Kelsey computes PRR, ROR, IC and EBGM. PRR, ROR and IC carry a 95% interval. EBGM carries EB05 and EB95, the 5th and 95th percentiles of its distribution, a central 90% interval. The quarterly history chart plots PRR or EB05, recalculated from the current snapshot with each case counted from its first receipt date; it does not rebuild the reports as they stood at each quarter end. The answer prints the rule it applied, for example "PRR ≥ 2, chi-squared ≥ 4, and at least 3 reports", and the date the EB05 threshold was met.
Lawyer-filed reports, counted apart
A report is lawyer-filed when FDA's occupation code for the reporter is LW. These reports stay out of the default measures, and every figure gives their number: "A further 2 lawyer-filed reports are not counted in these figures." The signal can be shown with them included. In the report list they are listed and marked. Manufacturers' reports can also start with a lawyer, so the count is a floor.
Duplicates, as a sensitivity check
The same patient and event can reach FDA under several case ids, when a manufacturer and a doctor both report it. Kelsey's Duplicate Check finds likely duplicates by Fellegi-Sunter record linkage, a probabilistic method of the kind vigiMatch applies to WHO's VigiBase.[2] It compares twelve fields: age, sex, event date, country, drugs, reactions, sender, manufacturer report number, literature reference, weight, outcomes and reporter occupation. It then shows how the measures move without the duplicates. The default count does not change.
Most FAERS reports lack the event date and country needed to link them, so the check finds a minority of the duplicates that exist.
The case reports
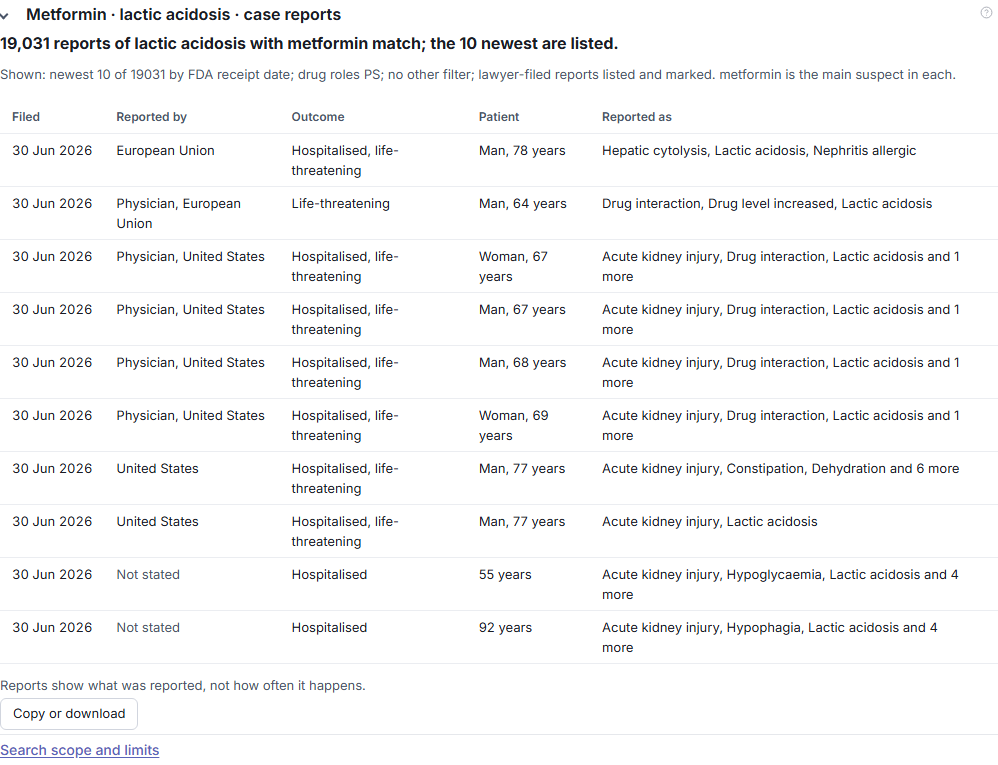
"19,031 reports of lactic acidosis with metformin match; the 10 newest are listed." The columns are Filed, Reported by, Outcome, Patient and Reported as. A row reads: 30 Jun 2026 · Physician, United States · Hospitalised, life-threatening · Man, 67 years · Acute kidney injury, Drug interaction, Lactic acidosis and 1 more. Downloaded as CSV, each row keeps its FAERS case id and primary id.
Other report cards: reports per quarter, onset and patient profile, who reported it, comparison with other drugs of the class, and reports in other countries.
What the reports cannot show
Every report card ends with "Reports show what was reported, not how often it happens." FDA states the limits:
- The reports "cannot be used to estimate the incidence (occurrence rates) of the events reported."[3]
- "For any given report, there is no certainty that a suspected drug caused the event."[3]
- "Some reports do not contain all the necessary information."[3]
Example questions
Does the reporting signal hold with lawyer-filed reports removed, and is there a trial or meta-analysis against it?
What comes back: The four measures computed both ways, and the studies on each side.
Which terms make up "eye damage", and which query and data version sit behind each number?
What comes back: The term list, the query run and the data snapshot behind each calculated figure.
Sources
- FDA, "FDA Adverse Event Monitoring System (AEMS)" (formerly FAERS), http://www.fda.gov/drugs/surveillance-post-drug-approval-activities/fda-adverse-event-monitoring-system-aems
- Tregunno PM, Fink DB, Fernandez-Fernandez C, Lázaro-Bengoa E, Norén GN, "Performance of probabilistic method to detect duplicate individual case safety reports," Drug Safety 2014, PMID 24627310, https://pubmed.ncbi.nlm.nih.gov/24627310/
- FDA, "FDA Adverse Event Monitoring System (AEMS) Public Dashboard," http://www.fda.gov/drugs/fda-adverse-event-monitoring-system-aems/fda-adverse-event-monitoring-system-aems-public-dashboard